This chapter describes how to generate and view the following reports:
Events registered reports
Actions taken reports
Availability reports
Diagnostic reports
Hardware reports
Software reports
System reports
Site reports
ESP generates reports based on parameters that you specify through the Web-based interface or command line interface.
In single system manager mode, ESP generates reports from the data that is stored in the ESP database on the local system. In system group manager mode, ESP generates reports from the information that is stored in the ESP database on the group manager system.
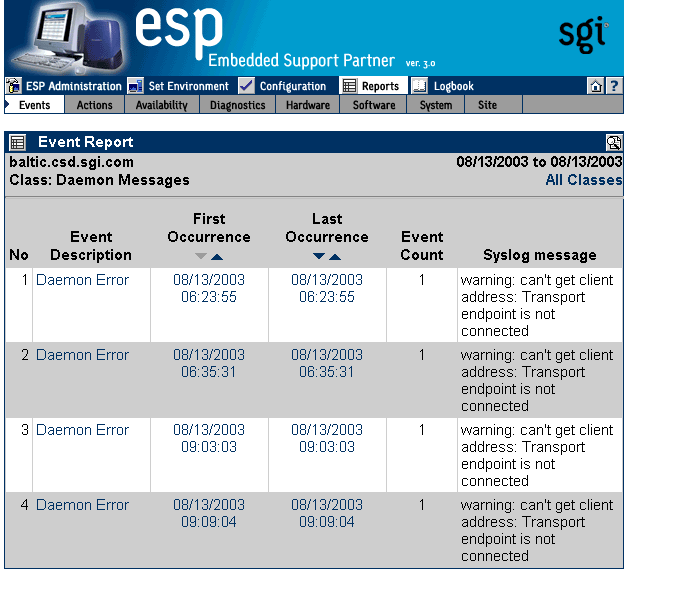
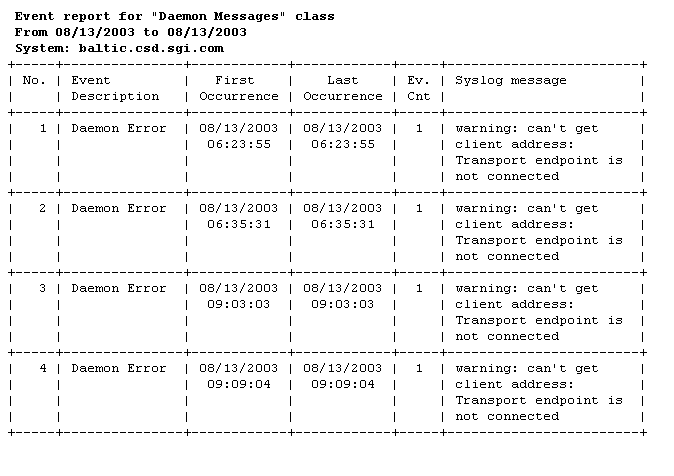
Figure 6-1 shows an example report generated by the Web-based interface. Figure 6-2 shows an example report generated by the Web-based interface in printable format.
If you use the Web-based interface to generate and view reports, there are several controls that you can use to navigate the reports. (Refer to Table 6-1.)
Table 6-1. Report Navigation Controls
Control | Function | |
|---|---|---|
| Select the number of report entries (records) to show on a page | |
| Select the software application to view in a software inventory report | |
Activate the selected menu options. | ||
Display the report in the printable format that shows an ASCII table with all report entries | ||
Expand all rows in the table to show subcomponents of each row | ||
Contract all rows in the table to show only the top-level components | ||
Contract the current row | ||
Expand the current row to show all subcomponents of the component shown in the row | ||
Go to the last page of report | ||
Go to the next page of the report | ||
Go to the previous page of the report | ||
Go to the first page of the report | ||
Sort by this column ascending. | ||
Sort by this column descending. |
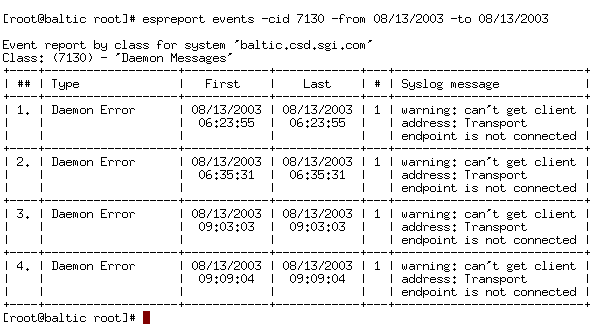
Figure 6-3 shows an example report generated by the command line interface.
Event registered reports show all events that ESP has registered within a specific time period.
Perform the following procedure to use the Web-based interface to generate an events registered report in single system manager mode:
Click on the Reports button.
Click on the Events button.
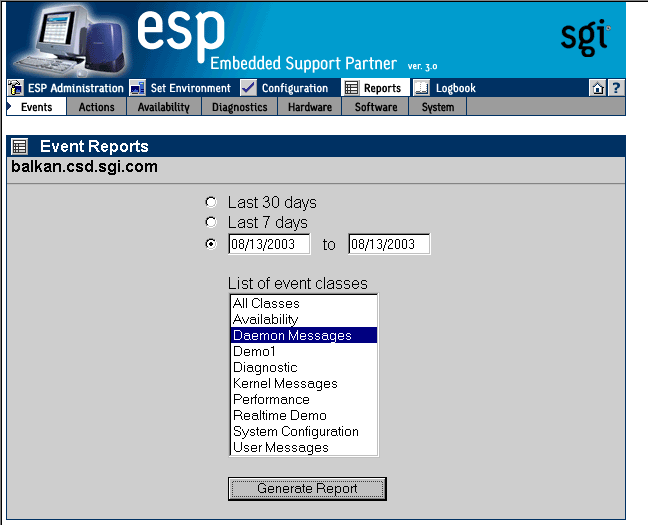
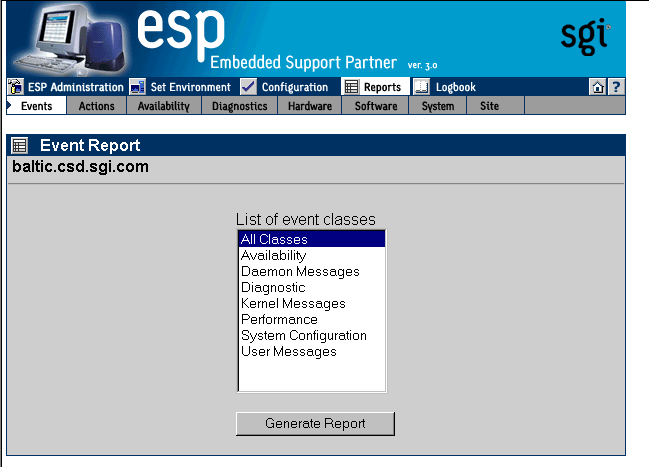
The interface displays the Event Reports window. (Refer to Figure 6-4.)
Specify the range of dates for the report.
Select the event classes that the report should include.
Click on the Generate Report button.
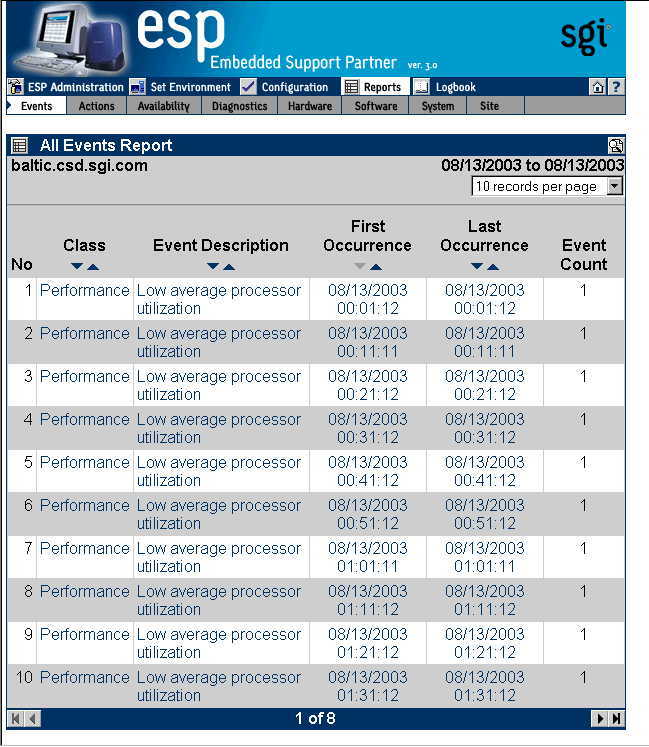
Figure 6-5 shows an example event report.
Table 6-2 describes the information that the report contains.
Table 6-2. Events Registered Report Contents (Single System Manager Mode)
Column Heading | Description |
|---|---|
No. | Index number within the table |
Class[a] | The class that contains the event Tip: Click on an event class to view a report of all occurrences of events in that class. |
Event Description | Brief description of the event Tip: Click on an event description to view a report of all occurrences of that event. |
First Occurrence | Date and time at which the event was first registered Tip: Click on the occurrence date to view the logbook entry for that date. |
Last Occurrence | Date and time at which the event was last registered Tip: Click on the occurrence date to view the logbook entry for that date. |
Event Count | Number of times that the event occurred |
Syslog message | Message from SYSLOG that generated the event |
[a] This column appears only if a report shows events from more than one class. | |
To “drill down” a report that contains events from multiple classes to find specific information about an event, perform the following procedure:
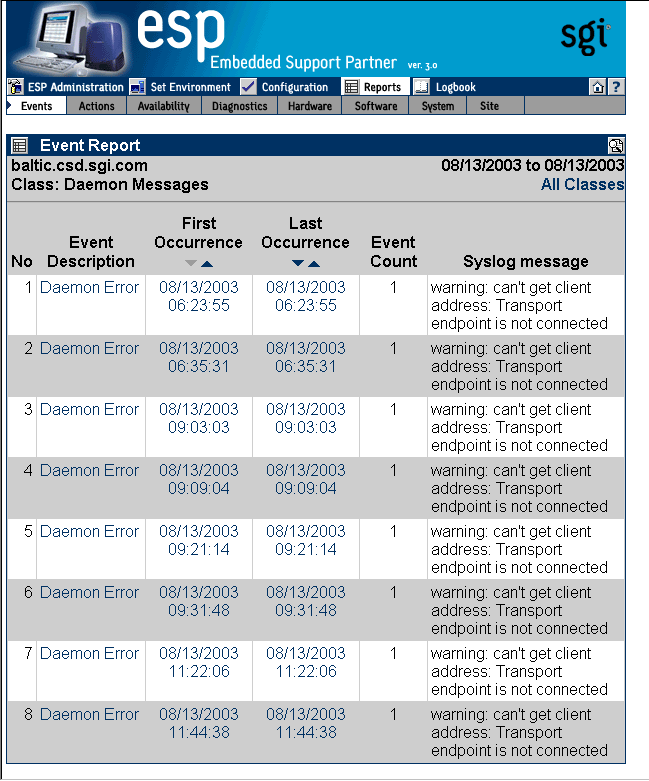
Click on the Class name.
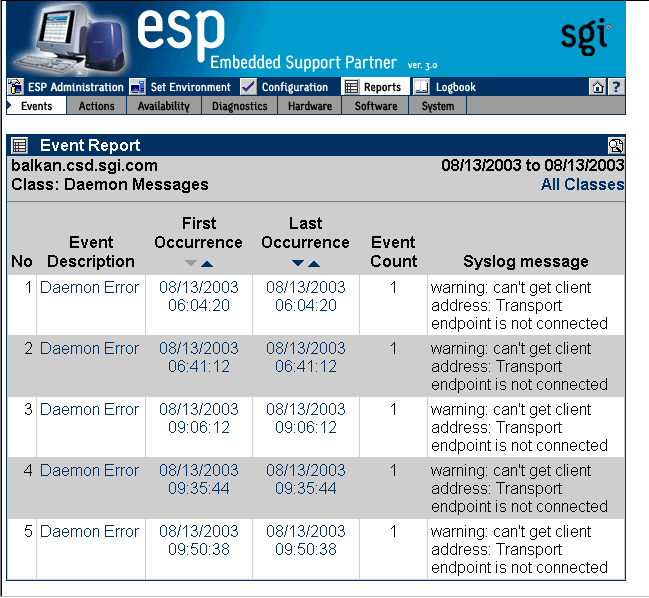
The interface displays information about events from the class that were registered. (Refer to Figure 6-6.)
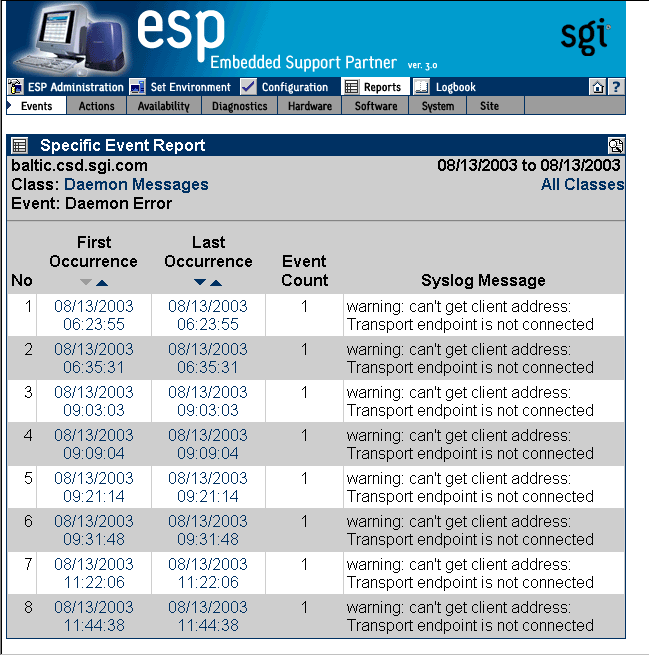
Click on the Event Description for the event.
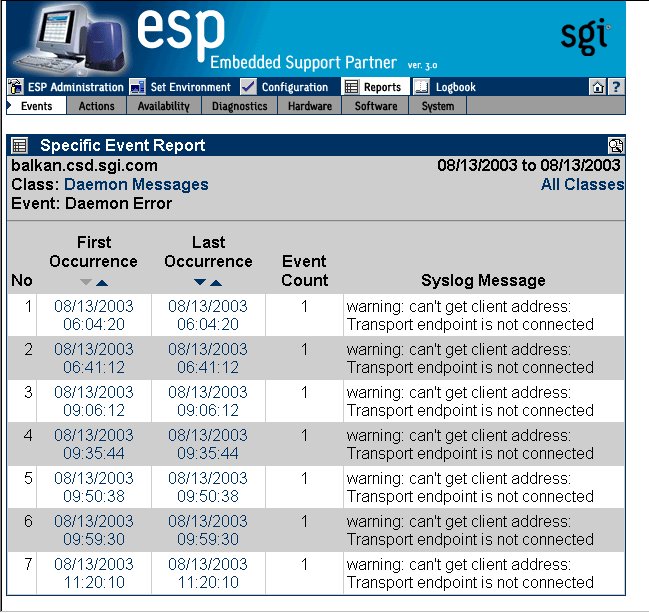
The interface displays all occurrences of the event. (Refer to Figure 6-7.)
Perform the following procedure to use the Web-based interface to generate an events registered report in system group manager mode:
Click on the Reports button.
Click on the Events button.
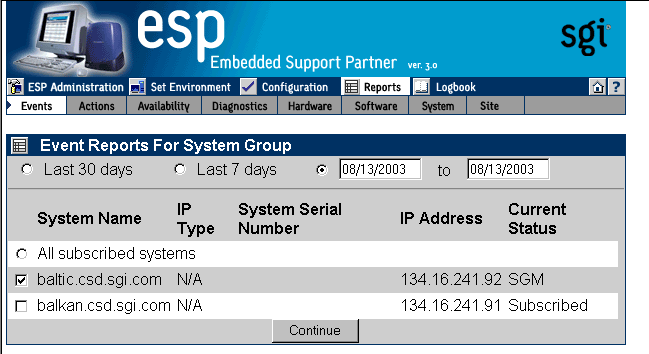
The interface displays the Event Reports For System Group window. (Refer to Figure 6-8.)
Specify the range of dates for the report.
Select the systems to include in the report.
Click on the Continue button.
The interface displays the list of classes. (Refer to Figure 6-9.)
Select the event classes to include in the report.
Click on the Generate Report button.
Figure 6-10 shows an example events registered report.
Table 6-3 describes the information that the report contains.
Table 6-3. Events Registered Report Contents (System Group Manager Mode)
Column Heading | Description |
|---|---|
No. | Index number within the table |
Class [a] | The class that contains the event Tip: Click on an event class to view a report of all occurrences of events in that class. |
Event Description | Brief description of the event Tip: Click on an event description to view a report of all occurrences of that event. |
First Occurrence | Date and time at which the event was first registered Tip: Click on the occurrence date to view the logbook entry for that date. |
Last Occurrence | Date and time at which the event was last registered Tip: Click on the occurrence date to view the logbook entry for that date. |
Event Count | Number of times that the event occurred |
System Name [b] | Client system on which the event occurred |
[a] This column appears only when reports contain more than one event class. [b] This column appears only on SGM systems when reports contain more than one system. | |
To “drill down” a report to find specific information about an event, perform the following procedure:
Click on the Class name.
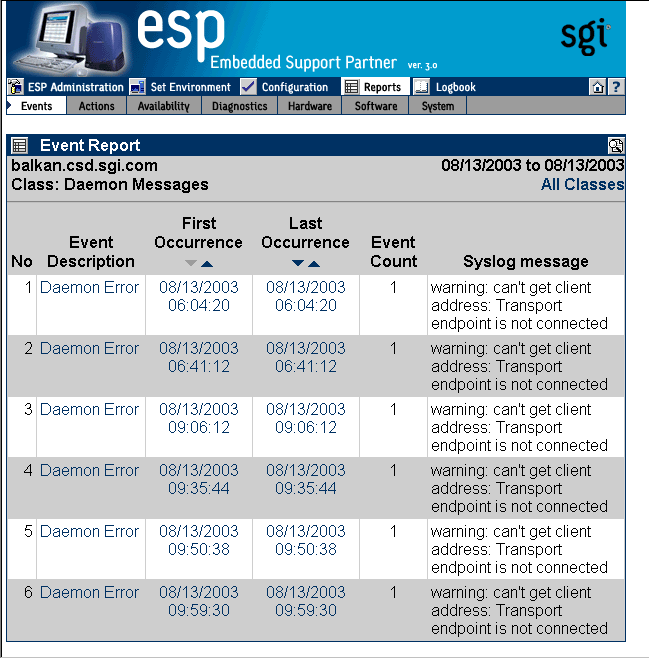
The interface displays information about events from the class that were registered. (Refer to Figure 6-11.)
Click on the Event Description for the event.
The interface displays all occurrences of the event. (Refer to Figure 6-12.)
Use the following syntax of the espreport command to view an events registered report:
/usr/sbin/espreport events  [-sysid <system id>| -host <hostname>]
                            [-from mm/dd/yyyy] [-to mm/dd/yyyy]
                            [-tid <type id>  | -td <type desc>]
                            [-cid <class id>  | -cd <class desc>]
|
On group manager systems, use the -sysid or -host options to select a specific system to include in the report. If you do not specify a system, the report contains events from the local host.
| Note: Enter /usr/sbin/esreport sysinfo all to determine the <system id> value. |
Use the -from and -to options to select the range of dates for the report. If you do not specify a range of dates, the report, the report contains all events that have been registered.
Use the -tid and -td options to select a specific event type. If you do not specify an event type, the report includes all events.
Actions taken reports show all actions that ESP performed within a specific time period.
Perform the following procedure to use the Web-based interface to generate an actions taken report in single system manager mode.
Click on the Reports button.
Click on the Actions button.
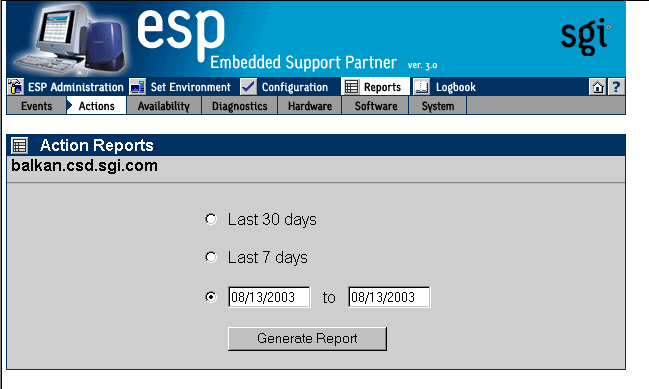
The interface displays the Action Reports window. (Refer to Figure 6-13.)
Specify the range of dates for the report.
Click on the Generate Report button.
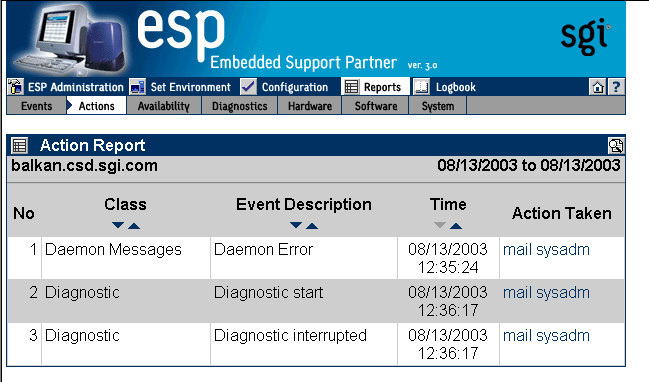
Figure 6-14 shows an example actions taken report.
Table 6-4 describes the information that the report contains.
Table 6-4. Actions Taken Report Contents (Single System Manager Mode)
Column | Description |
|---|---|
No. | Index number in the table |
Class | Class of the event to which the action is assigned |
Event Description | Description of the event to which the action is assigned |
Time | Time and date at that the action was taken |
Action Taken | Description of the command that the action performed Tip: Click on an action to view the parameter settings for the action. |
Perform the following procedure to use the Web-based interface to generate an actions taken report in system group manager mode.
Click on the Reports button.
Click on the Actions button.
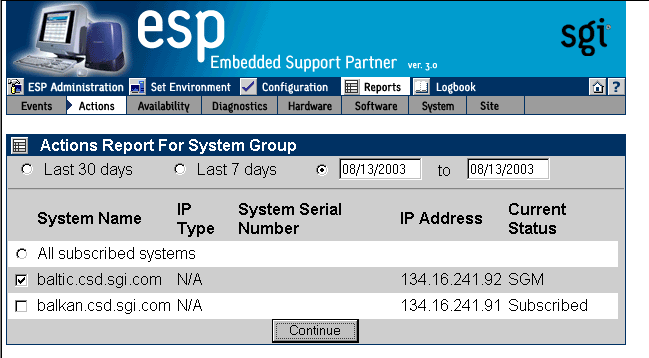
The interface displays the Actions Report For System Group window. (Refer to Figure 6-15.)
Specify the range of dates for the report.
Select the systems to include in the report.
Click on the Generate Report button.
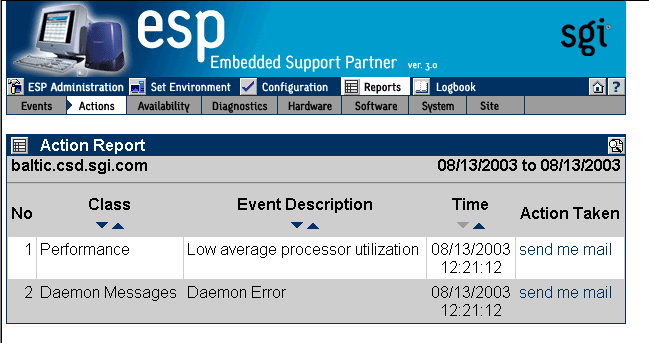
Figure 6-16 shows an example actions taken report.
Table 6-5 describes the information that the report contains.
Table 6-5. Actions Taken Report Contents (System Group Manager Mode)
Column | Description |
|---|---|
No. | Index number in the table |
Class[a] | Class of the event to which the action is assigned |
Event Description | Description of the event to which the action is assigned |
Time | Time and date at that the action was taken |
Action Taken | Description of the command that the action performed Tip: Click on an action to view the parameter settings for the action. |
System Name[b] | Client system on which the event occurred |
[a] This column appears only when reports contain more than one event class. [b] This column appears only on SGM systems when reports contain more than one system. | |
Use the following syntax of the espreport command to view an actions taken report:
/usr/sbin/espreport action_taken
                    [-sysid <system id> | -host <hostname>]
                    [-from mm/dd/yyyy] [-to mm/dd/yyyy]
|
Use the -sysid or -host options to select a specific system to include in the report. If you do not specify a system, the report contains actions from the local host.
| Note: Enter /usr/sbin/esreport sysinfo all to determine the <system id> value. |
Use the -from and -to options to select the range of dates for the report. If you do not specify a range of dates, the report displays all actions that have been taken.
Availability reports provide statistics about system availability from a specified time period.
Perform the following procedure to use the Web-based interface to generate availability reports in single system manager mode:
Click on the Reports button.
Click on the Availability button.
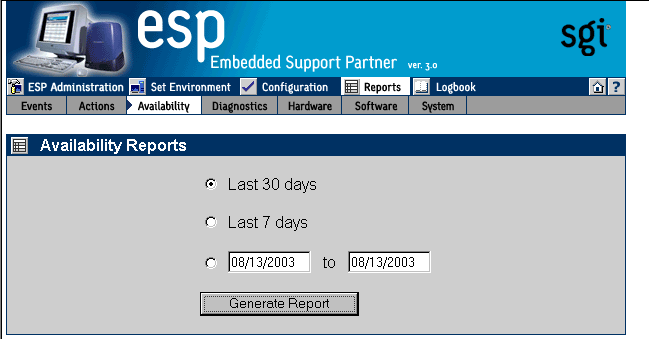
The interface displays the Availability Reports window. (Refer to Figure 6-17.)
Specify the range of dates for the report.
Click on the Generate Report button.
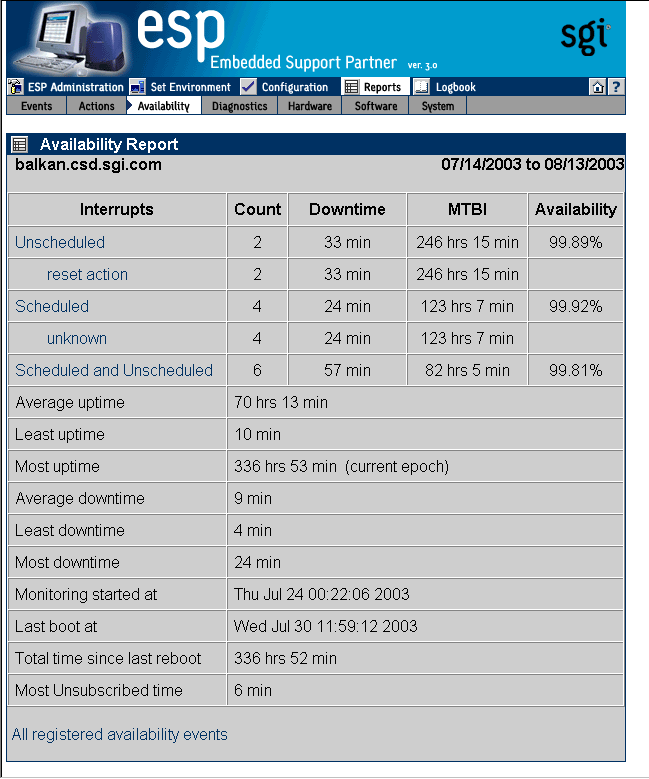
Figure 6-18 shows an example availability report.
Table 6-6 describes the contents of the report.
Table 6-6. Single System Availability Report Contents (Single System Manager Mode)
Row | Description |
|---|---|
Unscheduled | Information about any unscheduled downtime events: count, downtime due to the event (in minutes), mean time between interrupts (in minutes), and availability percentage |
Scheduled | Information about scheduled downtime events: count, downtime caused by the service action (in minutes), mean time between interrupts (in minutes), and availability percentage Tip: Click on the link to view a report of all scheduled availability events that ESP registered during the time period. |
Scheduled and Unscheduled | Information about the total downtime for scheduled and unscheduled downtime: count, downtime (in minutes) caused by the action, mean time between interrupts (in minutes), and availability percentage Tip: Click on the link to view a report of all scheduled and unscheduled availability events that ESP registered during the time period. |
Average uptime | Average uptime between availability events |
Least uptime | Shortest uptime between availability events |
Most uptime | Longest uptime between availability events |
Average downtime | Average downtime |
Least downtime | Shortest downtime |
Most downtime | Longest downtime |
Logging started at | Date and time that ESP began monitoring availability events |
Last boot at | Date and time of last system boot |
System has been up for | Length of time that system has been powered up since last system boot |
All registered availability events | Link to a table of all availability events that ESP registered during the specified time period |
Perform the following procedure to use the Web-based interface to generate availability reports in system group manager mode:
Click on the Reports button.
Click on the Availability button.
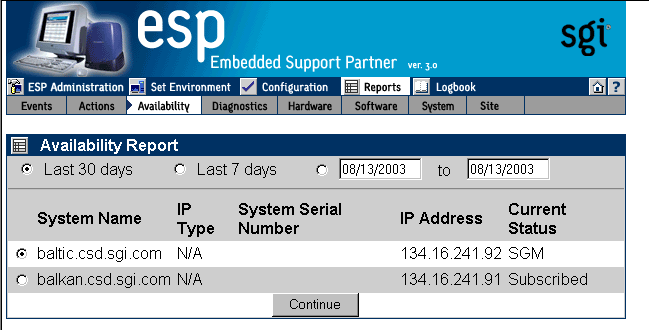
The interface displays the Availability Reports For System Group window. (Refer to Figure 6-19.)
Specify the range of dates for the report.
Select the systems to include in the report.
Click on the Generate Report button.
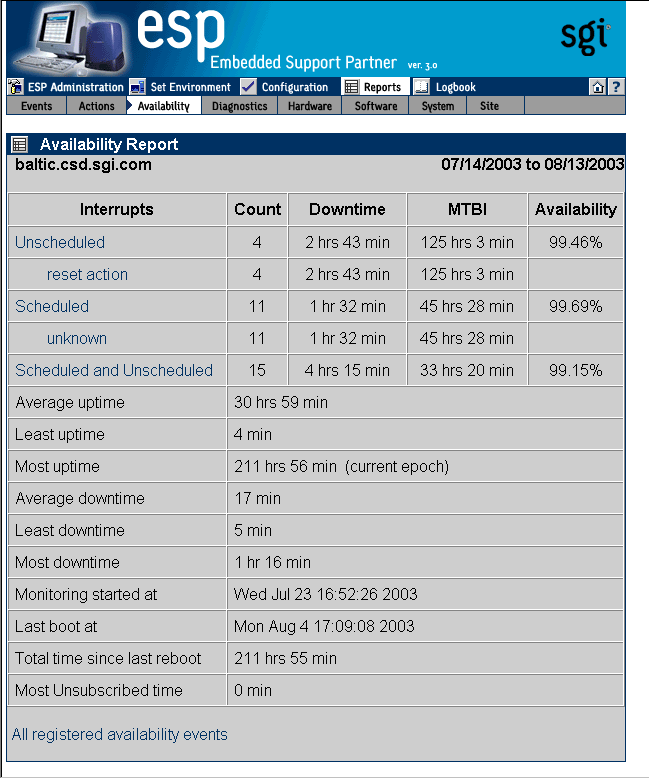
Figure 6-20 shows an example availability report for a specific host.
Table 6-7 describes the contents of the report.
Table 6-7. Single System Availability Report Contents (System Group Manager Mode)
Row
Description
Unscheduled
Information about any unscheduled downtime events: count, downtime due to the event (in minutes), mean time between interrupts (in minutes), and availability percentage
Scheduled
Information about scheduled downtime events: count, downtime caused by the service action (in minutes), mean time between interrupts (in minutes), and availability percentage
Tip: Click on the link to view a report of all scheduled availability events that ESP registered during the time period.
Scheduled and Unscheduled
Information about the total downtime for scheduled and unscheduled downtime: count, downtime (in minutes) caused by the action, mean time between interrupts (in minutes), and availability percentage
Tip: Click on the link to view a report of all scheduled and unscheduled availability events that ESP registered during the time period.
Average uptime
Average uptime between availability events
Least uptime
Shortest uptime between availability events
Most uptime
Longest uptime between availability events
Average downtime
Average downtime
Least downtime
Shortest downtime
Most downtime
Longest downtime
Logging started at
Date and time that ESP began monitoring availability events
Last boot at
Date and time of last system boot
System has been up for
Length of time that system has been powered up since last system boot
All registered availability events
Link to a table of all availability events that ESP registered during the specified time period
Use the following syntax of the espreport command to view an availability report:
/usr/sbin/espreport availability
                       [-sysid <system id>|-host <hostname>]
                       [-from mm/dd/yyyy] [-to mm/dd/yyyy]
|
Use the -sysid or -host options to select a specific system to include in the report. If you do not specify a system, the report contains availability information from the local host.
Use the -from and -to options to select the range of dates for the report. If you do not specify a range of dates, the report contains all information up to the current date.
If you use the diagnostics that are included in the Internal Support Tools 2.0 or later releases, ESP generates diagnostic results reports.
Perform the following procedure to use the Web-based interface to generate a diagnostic results report in single system manager mode:
Click on the Reports button.
Click on the Diagnostics button.
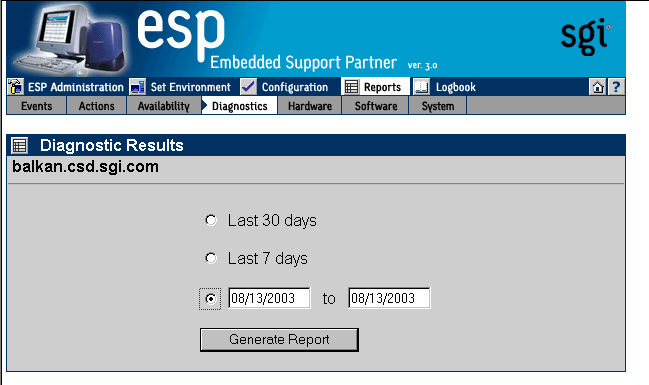
The interface displays the Diagnostic Results window. (Refer to Figure 6-21.)
Specify the range of dates for the report.
If you are using system group manager mode, select the systems to include in the report.
Click on the Generate Report button.
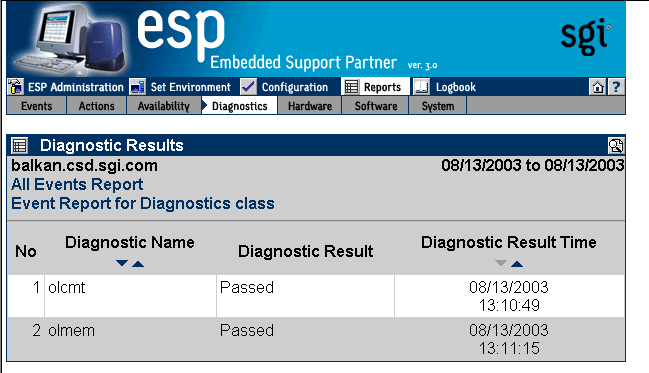
Figure 6-22 shows an example diagnostic results report.
Table 6-8 describes the contents of the report.
Table 6-8. Diagnostic Results Report Contents (Single System Manager Mode)
Column Heading | Description |
|---|---|
No. | Index number within the table |
Diagnostic Name | Name of the diagnostic When one or more tests run as a group under one program (for example, SVP), the total number of tests run is shown in parentheses next to the diagnostic name; for example: SVP (86) indicates that 86 tests ran under SVP |
Diagnostic Result | Result of the diagnostic: PASS, FAIL, or COMPLETE PASS indicates that the diagnostic completed successfully FAIL indicates that the diagnostic failed COMPLETE indicates that multiple tests ran and one or more of them failed and the others passed |
Diagnostic Result Time | Time at which the diagnostic completed testing When multiple tests run under one diagnostic (for example, SVP), this column indicates the time at which all tests completed |
Perform the following procedure to use the Web-based interface to generate a diagnostic results report in system group manager mode:
Click on the Reports button.
Click on the Diagnostics button.
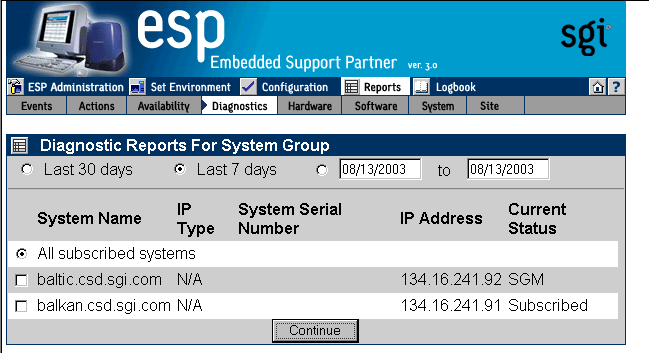
The interface displays the Diagnostic Results window. (Refer to Figure 6-23.)
Specify the range of dates for the report.
Specify the systems to include in the report.
Click on the Generate Report button.
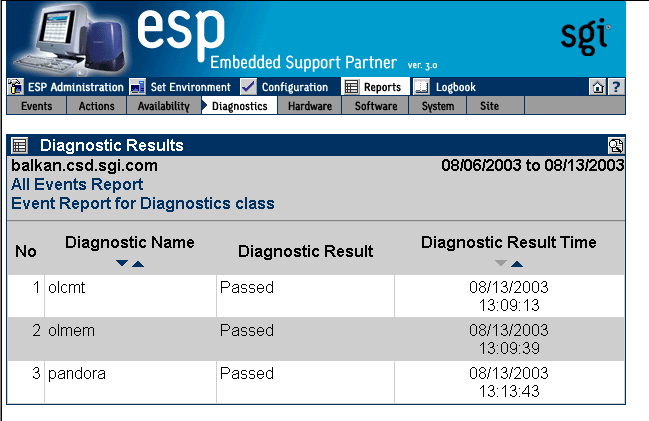
Figure 6-24 shows an example diagnostic results report.
Table 6-9 describes the contents of the report.
Table 6-9. Diagnostic Results Report Contents (System Group Manager Mode)
Column Heading | Description |
|---|---|
No. | Index number within the table |
Diagnostic Name | Name of the diagnostic When one or more tests run as a group under one program (for example, SVP), the total number of tests run is shown in parentheses next to the diagnostic name; for example: SVP (86) indicates that 86 tests ran under SVP |
Diagnostic Result | Result of the diagnostic: PASS, FAIL, or COMPLETE PASS indicates that the diagnostic completed successfully FAIL indicates that the diagnostic failed COMPLETE indicates that multiple tests ran and one or more of them failed and the others passed |
Diagnostic Result Time | Time at which the diagnostic completed testing When multiple tests run under one diagnostic (for example, SVP), this column indicates the time at which all tests completed |
System Name | Client system on which the action was taken |
There are two types of hardware reports:
Hardware inventory reports
Hardware changes reports
Hardware inventory reports show all hardware installed in a system at a specific date and time.
Perform the following procedure to use the Web-based interface to generate a hardware inventory report in single system manager mode:
Click on the Reports button.
Click on the Hardware button.
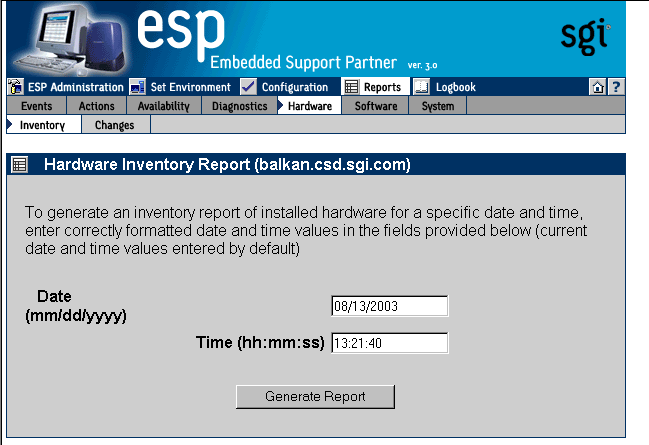
The interface displays the Hardware Inventory Report window. (Refer to Figure 6-25.)
Specify the date and time of the hardware inventory that you want to view.
Click on the Generate Report button.
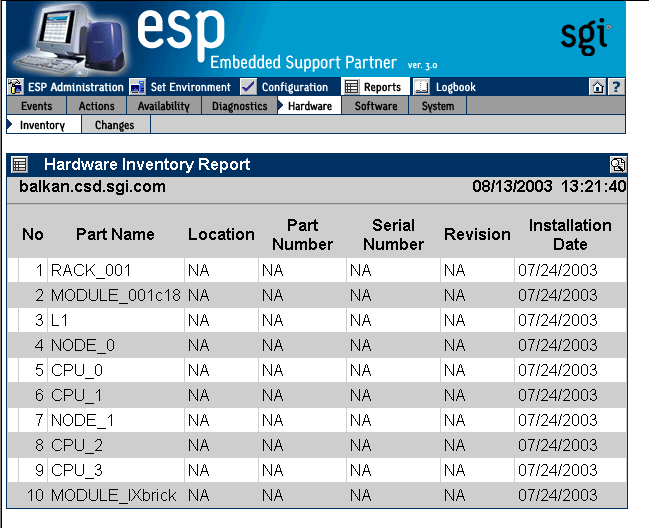
Figure 6-26 shows an example hardware inventory report.
Table 6-10 describes the contents of the report.
Table 6-10. Hardware Inventory Report Contents
Column Heading | Description |
|---|---|
No. | Index number within the table |
Part Name | Name of the part |
Location | Location where the part is installed |
Part Number | Part number for the part |
Serial Number | Serial number of the part |
Revision | Revision level of the part |
Installation Date | Date that the part was installed |
Perform the following procedure to use the Web-based interface to generate a hardware inventory report in system group manager mode:
Click on the Reports button.
Click on the Hardware button.
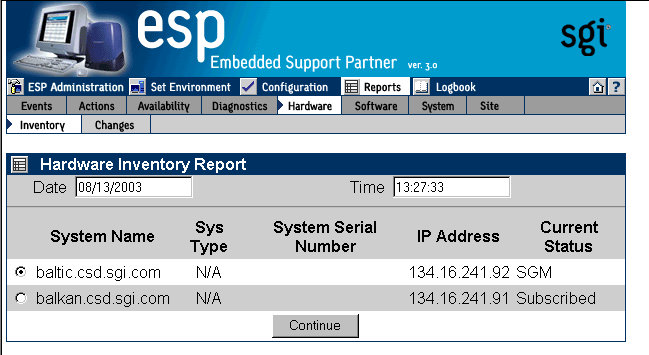
The interface displays the Hardware Inventory Reports for System Group window. (Refer to Figure 6-27.)
Specify the date and time of the hardware inventory that you want to view.
Specify the system for the hardware inventory that you want to view.
Click on the Generate Report button.
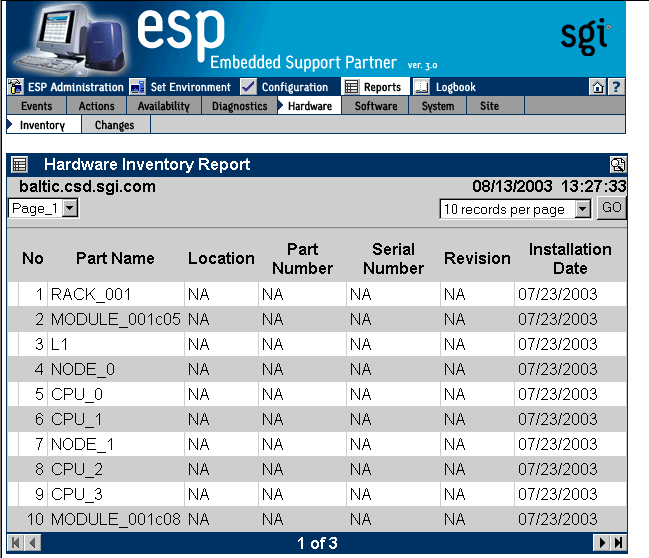
Figure 6-28 shows an example hardware inventory report.
Table 6-11 describes the contents of the report.
Table 6-11. Hardware Inventory Report Contents (System Group Manager Mode)
Column Heading | Description |
|---|---|
No. | Index number within the table |
Part Name | Name of the part |
Location | Location where the part is installed |
Part Number | Part number for the part |
Serial Number | Serial number of the part |
Revision | Revision level of the part |
Installation Date | Date that the part was installed |
Hardware changes reports show all hardware that has been installed or deinstalled with a specified time period.
Perform the following procedure to use the Web-based interface to generate a hardware changes report from single system manager mode:
Click on the Reports button.
Click on the Hardware button.
Click on the Changes button.
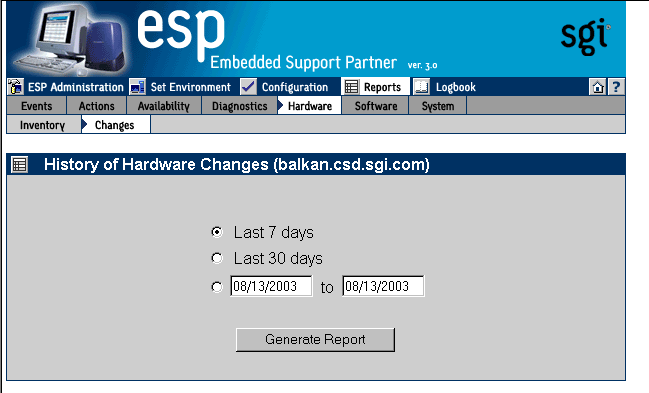
The interface displays the History of Hardware window. (Refer to Figure 6-29.)
Specify the range of dates for the report.
Click on the Generate Report button.
Figure 6-30 shows an example hardware changes report.
Table 6-12 describes the contents of the report.
Table 6-12. Hardware Changes Report Contents (Single System Manager Mode)
Column Heading | Description |
|---|---|
No. | Index number in the table |
Part Name | Name of the part |
Location | Location of the part |
Serial Number | Serial number of the part |
Part Number | Part number of the part |
Revision | Revision level of the part |
Install Date/Time | Date and time that the part was installed in the location |
Removal Date/Time | Date and time that the part was removed from the location |
Perform the following procedure to use the Web-based interface to generate a hardware changes report from system group manager mode:
Click on the Reports button.
Click on the Hardware button.
Click on the Changes button.
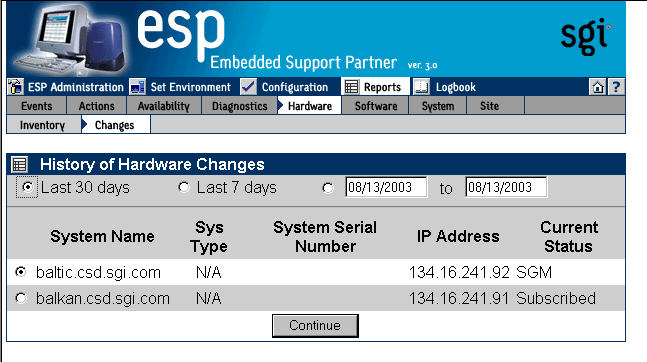
The interface displays the Hardware Changes Report For System window. (Refer to Figure 6-31.)
Specify the range of dates for the report.
Click on the Generate Report button.
Figure 6-32 shows an example hardware changes report.
Table 6-13 describes the contents of the report.
Table 6-13. Hardware Changes Report Contents (System Group Manager Mode)
Column Heading | Description |
|---|---|
No. | Index number in the table |
Part Name | Name of the part |
Location | Location of the part |
Serial Number | Serial number of the part |
Part Number | Part number of the part |
Revision | Revision level of the part |
System Name | System on which the part is located |
Install Date/Time | Date and time that the part was installed in the location |
Remove Date/Time | Date and time the part was removed from the location |
Use the following syntax of the espreport command to view a hardware changes report:
/usr/sbin/espreport hwchanges
                         [-sysid <system id> | -host <host name>]
                         [-from <mm/dd/yyyy>] [-to <mm/dd/yyyy>]
|
Use the -from and -to options to specify a range of dates. If you do not use these options, the report includes all available data.
There are two types of software reports:
System inventory reports
System changes reports
Software inventory reports show all software installed on a system at a specific date and time.
Perform the following procedure to use the Web-based interface to generate a software inventory report from single system manager mode:
Click on the Reports button.
Click on the Software button.
Click on the Inventory button.
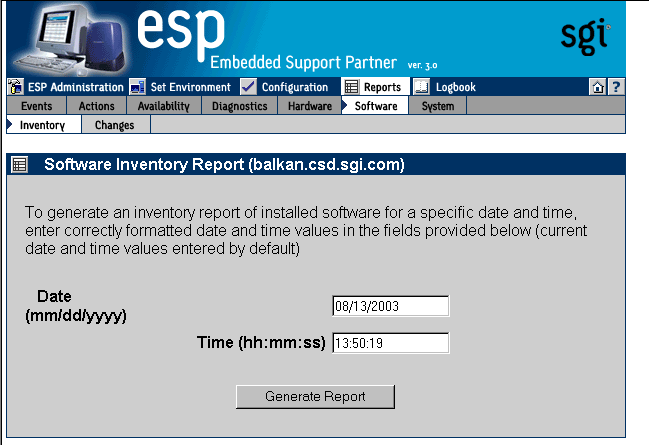
The interface displays the Software Inventory Report window. (Refer to Figure 6-33.)
Specify the date and time of the software inventory that you want to view.
Click on the Generate Report button.
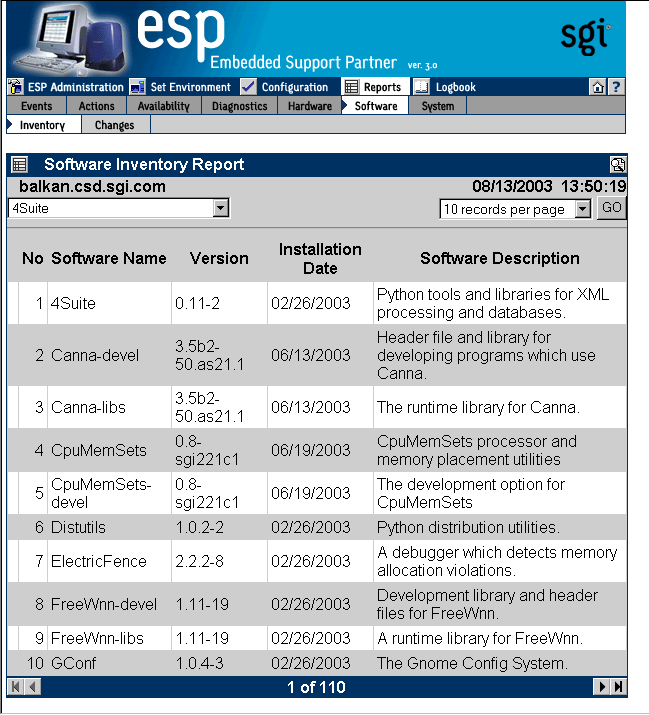
Figure 6-34 shows an example software inventory report.
Table 6-14 describes the contents of the report.
Table 6-14. Software Inventory Report Contents (Single System Manager Mode)
Column Heading
Description
No.
Index number within the table
Software Name
Name of the software application
Version
Version number of the software application
Installation Date
Date on which the software application was installed
Software Description
Brief description of the software
Perform the following procedure to use the Web-based interface to generate a software inventory report from system group manager mode:
Click on the Reports button.
Click on the Software button.
Click on the Inventory button.
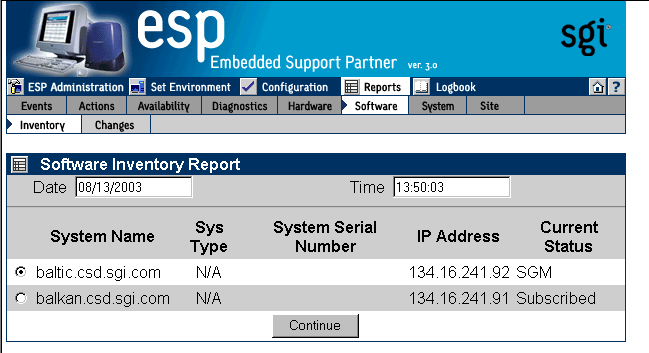
The interface displays the Software Inventory Reports for System Group window. (Refer to Figure 6-35.)
Specify the date and time of the software inventory that you want to view.
Click on the Generate Report button.
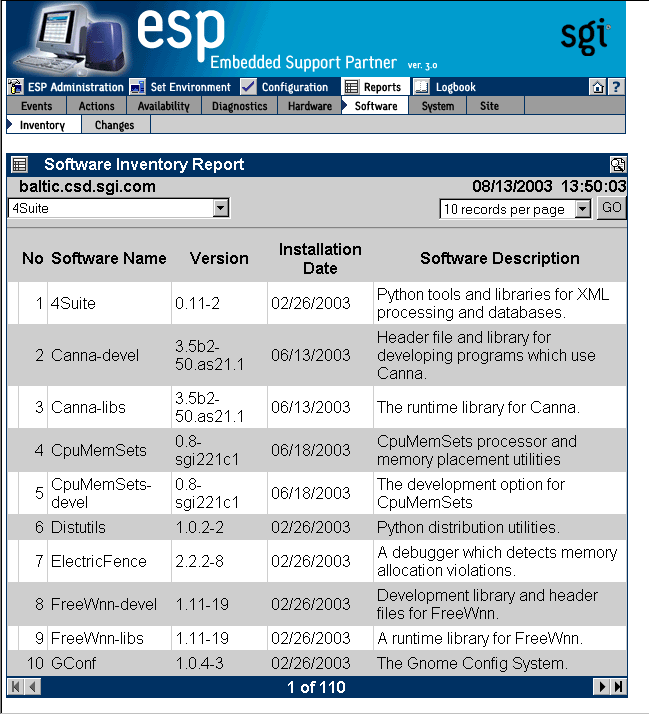
Figure 6-36 shows an example software inventory report.
Table 6-15 describes the contents of the report.
Table 6-15. Software Inventory Report Contents (System Group Manager Mode)
Column Heading
Description
No.
Index number within the table
Software Name
Name of the software application
Version
Version number of the software application
Installation Date
Date on which the software application was installed
Software Description
Brief description of the software
Software changes reports show all software that has been added to or removed from a system within a specific time period.
Perform the following procedure to use the Web-based interface to generate a software changes report from single system manager mode:
Click on the Reports button.
Click on the Software button.
Click on the Changes button.
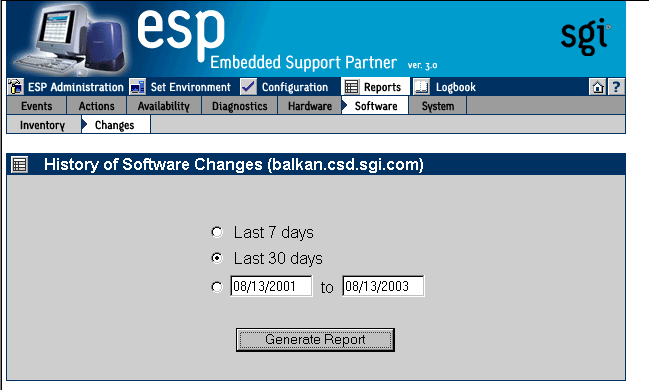
The interface displays the History of Software Changes window. (Refer to Figure 6-37.)
Specify the range of dates for the report.
Click on the Generate Report button.
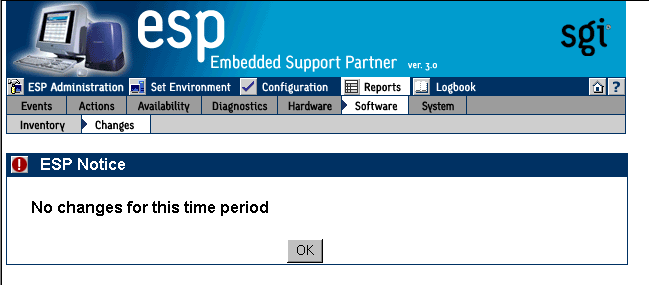
Figure 6-38 shows an example software changes report.
Table 6-16 describes the contents of the report.
Table 6-16. Software Changes Report Contents (Single System Manager Mode)
Column Heading | Description |
|---|---|
No. | Index number in the table |
Software Name | Name of the software application |
Software Version | Version number of the software application |
Installation Date | Date that the software application was installed on the system |
Removal Date/Time | Date that the software application was removed from the system |
Description | Description of the software application |
Perform the following procedure to use the Web-based interface to generate a software changes report from system group manager mode:
Click on the Reports button.
Click on the Software button.
Click on the Changes button.
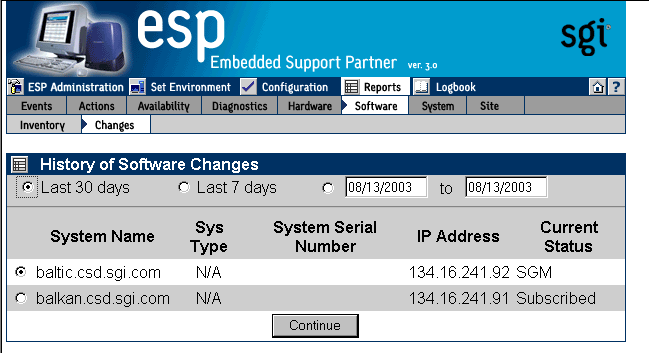
The interface displays the History of Software Changes For System Group window. (Refer to Figure 6-39.)
Specify the range of dates for the report.
Select the system to include in the report.
Click on the Generate Report button.
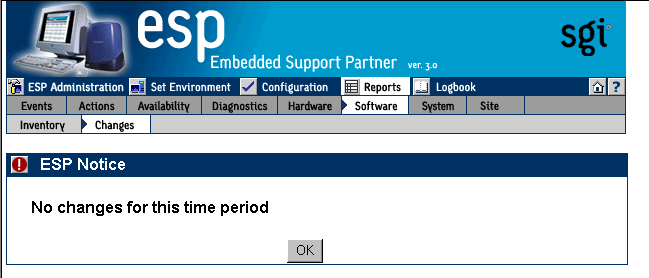
Figure 6-40 shows an example software changes report.
Table 6-17 describes the contents of the report.
Table 6-17. Software Changes Report Contents (System Group Manager Mode)
Column Heading | Description |
|---|---|
No. | Index number in the table |
Software Name | Name of the software application |
Software Version | Version number of the software application |
Installation Date | Date that the software application was installed on the system |
Removal Date/Time | Date that the software application was removed from the system |
Description | Description of the software application |
Use the following syntax of the espreport command to view a software changes report:
/usr/sbin/espreport swchanges
                     [-sysid <system id> | -host <host name>]
                     [-from <mm/dd/yyyy>] [-to <mm/dd/yyyy>]
|
Use the -from and -to options to specify a range of dates. If you do not use these options, the report includes all available data.
There are two types of system reports:
System inventory reports
System changes reports
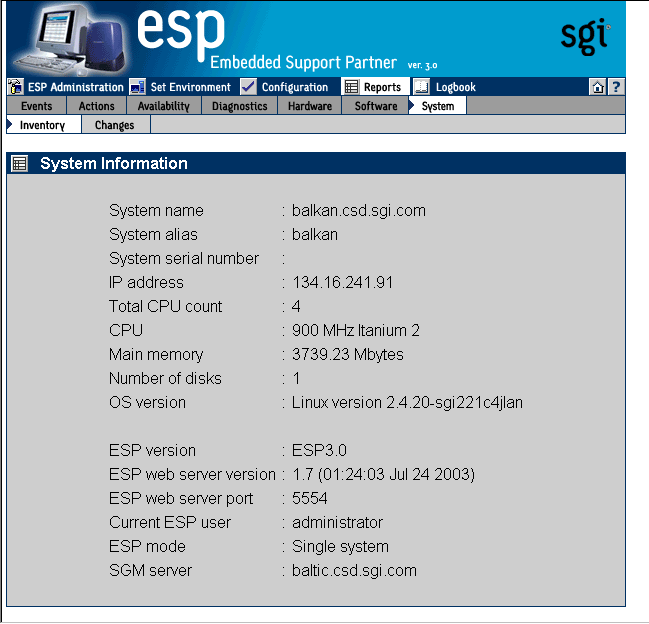
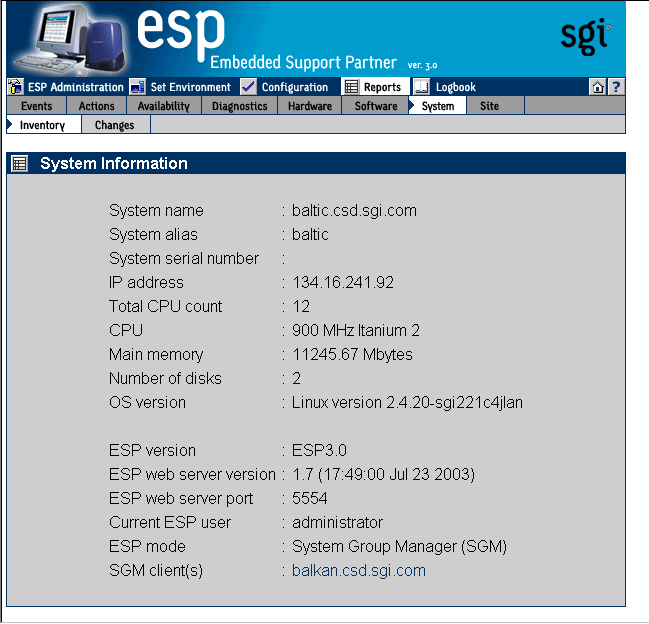
System inventory reports show the current system and ESP information.
Perform the following procedure to use the Web-based interface to generate a system inventory report:
Click on the Reports button.
Click on the System button.
Click on the Inventory button.
The interface displays the System window. (Figure 6-41 shows an example system inventory report in single system manager mode. Figure 6-42 shows an example system inventory report in system group manager mode.)
Use the following syntax of the espreport command to generate a system information report:
/usr/sbin/espreport sysinfo
                     [-sysid <system id> | -host <host name>]
                     [all]
|
If you specify the all option, the command displays the system name, serial number, type, IP address, and system ID. If you do not specify the all option, this command displays only the system serial number.
Use the following syntax of the espreport command to view a summary report that includes system information, events, hardware and software changes, logbook information, availability overview, and local system disk usage:
/usr/sbin/espreport summary
                     [-sysid <system id> | -host <host name>]
                     [-from <mm/dd/yyyy>] [-to <mm/dd/yyyy>]
|
Use the -from and -to options to specify a range of dates. If you do not use these options, the report includes all available data.
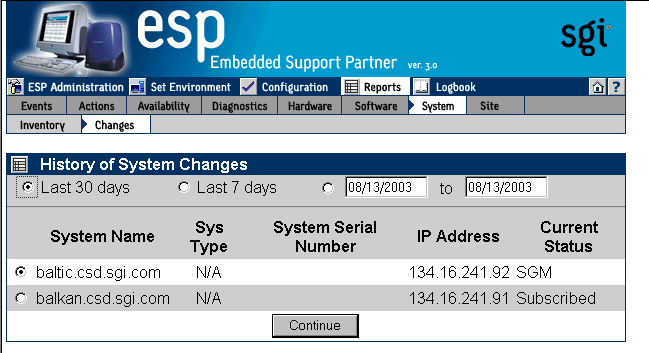
System change reports show any system changes (system name, IP address, etc.) that occur within a specific time period.
Perform the following procedure to use the Web-based interface to generate a system inventory report from single system manager mode:
Click on the Reports button.
Click on the System button.
Click on the Changes button.
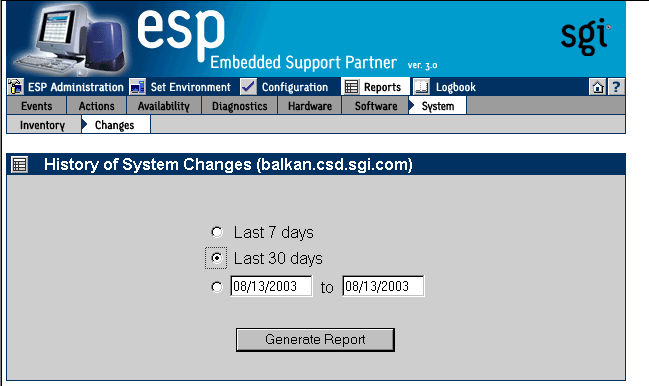
The interface displays the History of System Changes window. (Refer to Figure 6-43.)
Specify the range of dates for the report.
Click on the Generate Report button.
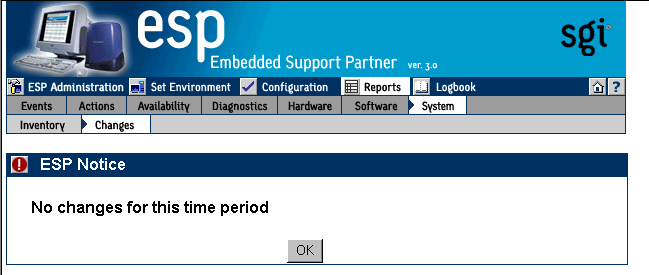
Figure 6-44 shows an example system changes report.
Table 6-18 describes the contents of the report.
Table 6-18. System Changes Report Contents (Single System Manager Mode)
Column Name | Description |
|---|---|
SysId | System identification number |
System type | Processor that the system uses |
System serial number | Serial number of the system |
Hostname | Hostname of the system |
IP address | IP address of the system |
Date/Time | Date and time of the change |
Perform the following procedure to use the Web-based interface to generate a system inventory report from system group manager mode:
Click on the Reports button.
Click on the System button.
Click on the Changes button.
The interface displays the System Changes For System Group window. (Refer to Figure 6-45.)
Specify the range of dates for the report.
Specify the systems to include in the report.
Click on the Generate Report button.
Figure 6-46 shows an example system changes report.
Table 6-19 describes the contents of the report.
Table 6-19. System Changes Report Contents (System Group Manager Mode)
Column Name | Description |
|---|---|
SysId | System identification number |
System type | Processor that the system uses |
System serial number | Serial number of the system |
Hostname | Hostname of the system |
IP address | IP address of the system |
Date/Time | Date and time of the change |
Site reports show information for various combinations of systems at a site. ESP limits site reports to include only systems that meet specific criteria, including:
Systems that are in a specific group
Systems that run a specific operating system version
Systems that have a specific processor type
Site reports can contain system information, all available events, or specific events by class for the selected systems. Site reports are available only from SGM servers.
Perform the following procedure to use the Web-based interface to generate a site inventory report from system group manager mode:
Click on the Reports button.
Click on the Site button.
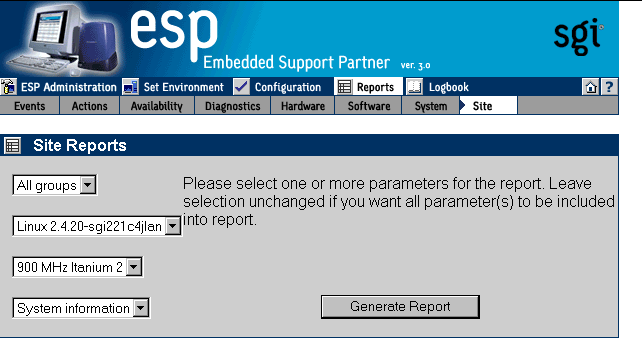
The interface displays the Site Reports window. (Refer to Figure 6-47.)
Select the items to include in the report:
Choose the groups that you want to include in the report. The pulldown menu includes the names of all groups that are available. When you choose a group name from the menu, the report contains only the systems in the group that you select. Choose All groups to include all systems in the report.
Choose the operating system that you want to include in the report. The pulldown menu includes the name of all operating systems that ESP detected on the systems. When you choose an operating system from the menu, the report contains only systems that are running that operating system.
Choose a processor type. The pulldown menu includes all processor types that ESP detected in the systems. When you choose a processor type from the menu, the report contains only systems that contain that type of processor.
Choose the type of site report to generate. The following options are available:
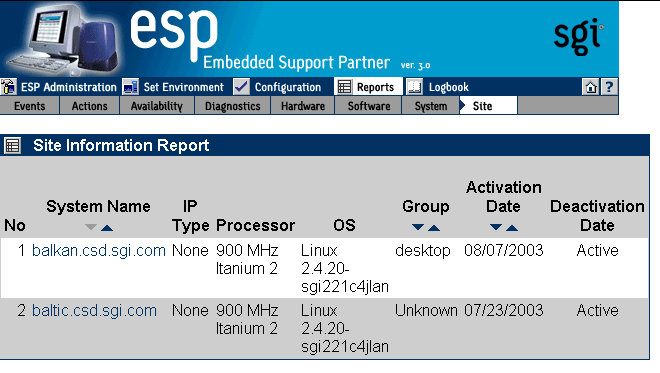
The System information option generates a site information report, which includes the following information: system name, IP type (if applicable), processor type, OS version, the group that includes the system, the system activation date (the date when system was added to the group for the first time), and system deactivation date (the date when system was unsubscribed).
The All events option generates a report of all available events.
The Events by class generates a report of events from specific classes.
Click on the Generate Report button.
The interface displays the report. (Figure 6-48 shows an example of a site information report.)
