Research
Large scale structures
Recently, several sky surveys showed that galaxies are not randomly distributed in the Universe, being clumped into larger structures, so-called galaxy clusters and superclusters. In particular, superclusters of galaxies present typical masses of ~1017 Msun and up to ~100 Mpc length. They preserve information on the primordial Universe (clustering) and are excelent "laboratories" to investigate galaxy evolution, presenting different galaxy types and environments (Costa-Duarte et al. 2011, 2013).
Empirical Spectral Synthesis
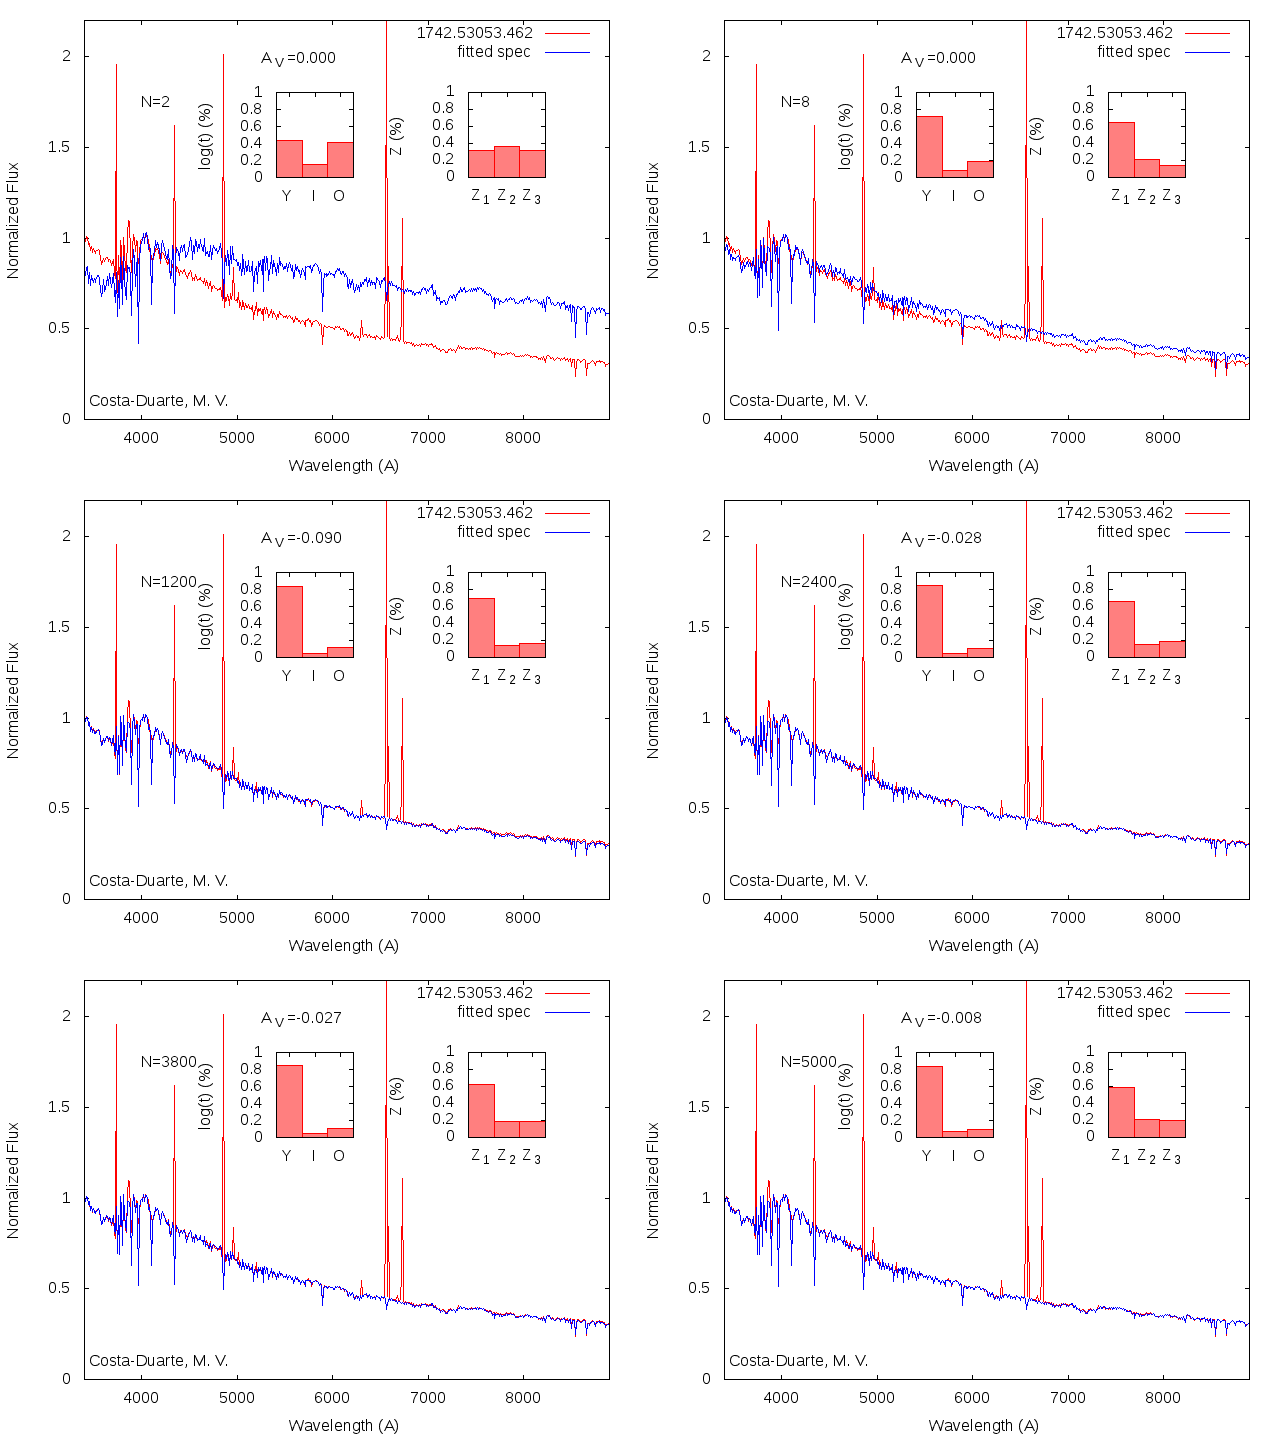
The spectral synthesis represents a powerful technique decomposes the observed spectrum of galaxies into several simple stellar populations (SSPs), allowing us to investigate its mass assembly and the star formation history though the cosmic time of the Universe. Representative features of stellar population, such as light/mass weighted age and metallicity, intrinsic extinction are also other output products of the spectral synthesis. Many codes in the literature use distinct approaches to carry out this fitting (e.g. STARLIGHT and VESPA ). This tool is mandatory to investigate how galaxies evolve in the Universe, evaluating the role of the environment and internal processes, such as active-galaxy nuclei. The animation below shows how the empirical spectral synthesis works. The contributions of SSPs with different ages and metallicities are summarized by metallicity (Z) and age (logt) histograms during the spectral fitting.

Photometric Redshift
The spectroscopy is a time-consuming technique, specially for sky surveys which cover large areas and goes deep, however, it frequently provides high precision for redshifts. On the other hand, photometric redshifts represents an alternative to determine the distance of galaxies. This technique consists of using only photometric bands to predict redshifts. It represents a gain in number of objects (including fainter objects which would not be observed by spectroscopy) but its precision is systematically larger. Different approaches are employed to determine the photometric redshifts, being template-based (e.g. BPZ) and machine learning (e.g. ANNz2). Photometric redshift should be considered in a statistical way for large samples and not for only one object. This approach is able to recover galaxy clustering and the galaxy environment, depending on the photo-z precision.
Machine Learning applied to Large Surveys
Some photometric sky surveys presently propose high number of photometric bands (>10) in order to increase the photometric redshift precision. These bands are strategically designed to deliver informative photometry of galaxies and stars. As consequence, it is mandatory to re-invent the way astronomers do science. The high number of photometric bands (high-dimensional space) demands us to employ new tools to interpret the results. Machine learning is a suitable approach to "digest this high-dimensional database. Artificial Neural Networks (ANN), Random Forest (RF) and Suport Vector Machine (SVM) are examples of techniques to classify and/or predict features. Furthermore, machine learning is quite sensitive to inputs. Training samples must be representative of the observed data to correctly classify objects or predict features.