Tuning an application involves determining the source of performance problems and then rectifying those problems to make your programs run their fastest on the available hardware. Performance gains usually fall into one of three categories of mesured time:
User CPU time: time accumulated by a user process when it is attached to a CPU and is executing.
Elapsed (wall-clock) time: the amount of time that passes between the start and the termination of a process.
System time: the amount of time performing kernel functions like system calls, sched_yield, for example, or floating point errors.
Any application tuning process involves:
Analyzing and identifying a problem
Locating where in the code the problem is
Applying an optimization technique
This chapter describes the process of analyzing your code to determine performance bottlenecks. See Chapter 6, “Performance Tuning”, for details about tuning your application for a single processor system and then tuning it for parallel processing.
One of the first steps in application tuning is to determine the details of the system that you are running. Depending on your system configuration, different options may or may not provide good results.
To determine the details of the system you are running, you can browse files from the /proc pseudo-filesystem (see the proc(5) man page for details). Following is some of the information you can obtain:
/proc/cpuinfo: displays processor information, one entry per processor. Use this to determine clock speed and processor stepping.
/proc/meminfo: provides a global view of system memory usage, such as total memory, free memory, swap space, and so on.
/proc/discontig: shows memory usage (in pages).
/proc/pal/cpu0/cache_info: provides detailed information about L1, L2, and L3 cache structure, such as size, latency, associativity, line size, and so on. Other files in /proc/pal/cpu0 provide information about the Translation Lookaside Buffer (TLB) structure, clock ratios, and other details.
/proc/version: provides information about the installed kernel.
/proc/perfmon: if this file does not exist in/proc (that is, if it has not been exported), performance counters have not been started by the kernel and none of the performance tools that use the counters will work.
/proc/mounts: provides details about the filesystems that are currently mounted.
/proc/modules: contains details about currently installed kernel modules.
You can also use the uname command, which returns the kernel version and other machine information. In addition, the topology command displays system configuration information. See Chapter 4, “Monitoring Tools” for more information.
There are usually three areas of program execution that can have performance slowdowns:
CPU-bound processes: processes that are performing slow operations (such as sqrt or floating-point divides) or non-pipelined operations such as switching between add and multiply operations.
Memory-bound processes: code which uses poor memory strides, occurrences of page thrashing or cache misses, or poor data placement in NUMA systems.
I/O-bound processes: processes which are waiting on synchronous I/O, formatted I/O, or when there is library or system level buffering.
Several profiling tools can help pinpoint where performance slowdowns are occurring. The following sections describe some of these tools.
The pfmon tool is a performance monitoring tool designed for Linux. It uses the Itanium Performance Monitoring Unit (PMU) to count and sample unmodified binaries. In addition, it can be used for the following tasks:
To monitor unmodified binaries in its per-CPU mode.
To run system-wide monitoring sessions. Such sessions are active across all processes executing on a given CPU.
Launch a system-wide session on a dedicated CPU or a set of CPUs in parallel.
Monitor activities happening at the user level or at the kernel level.
Collect basic hardware event counts (There are 477 hardware events.)
Sample program or system execution, monitoring up to four events at a time.
To see a list of available options, use the pfmon -help command. You can only run pfmon one CPU or conflict at a time.
The profile.pl script handles the entire user program profiling process. Typical usage is as follows:
% profile.pl -c0-3 -x6 command args |
This script designates processors 0 through 3. The -x6 option is necessary only for OpenMP codes.
The result is a profile taken on the CPU_CYCLES PMU event and placed into profile.out. This script also supports profiling on other events such as IA64_INST_RETIRED, L3_MISSES, and so on; see pfmon -l for a complete list of PMU events. The script handles running the command under the performance monitor, creating a map file of symbol names and addresses from the executable and any associated dynamic libraries, and running the profile analyzer.
See the profile.pl(1), analyze.pl(1), and makemap.pl(1) man pages for details. You can run profile.pl one at a time per CPU or conflict. Profiles all processes on the specified CPUs.
For MPI programs, use the profile.pl command with the -s1 option, as in the following example:
% mpirun -np 4 profile.pl -s1 -c0-3 test_prog </dev/null |
The use of /dev/null ensures that MPI programs run in the background without asking for TTY input.
The histx software is a set of tools used to assist with application performance analysis. It includes three data collection programs and three filters for performance data post-processing and display. The following sections describe this set of tools.
Three programs can be used to gather data for later profiling:
histx: A profiling tool that can sample either the program counter or the call stack.
The histx data collection programs monitors child processes only, not all proccesses on a CPU like pfmon. It will not show the profile conflicts that the pfmon command shows.
The syntax of the histx command is as, as follows:
histx [-b width] [-f] [-e source] [-h] [-k] -o file [-s type] [-t signo] command args...
The histx command accepts the following options:
-b width Specifies bin bits when using instruction pointer sampling: 16,32 or 64 (default: 16).
-e source Specifies event source (default: timer@1).
-f Follow fork (default: off).
-h This message (command not run).
-k Also count kernel events for program source (default: off).
-o file Sends output to file. prog.pid. (REQUIRED).
-s type Includes line level counts in instruction pointer sampling report (default: off).
-t signo `Toggles' signal number (default: none).
lipfpm: Reports counts of desired events for the entire run of a program.
The syntax of the lipfpm command is as, as follows:
lipfpm [-c name] [-e name]* [-f] [-i] [-h] [-k] [-l] [-o path] [-p] command args...
The lipfpm command accepts the following options:
-c name Requests named collection of events; may not be used with -i or -e arguments.
-e name Specifies events to monitor (for event names see Intel documents).
-f Follow fork (default: off).
-i Specify events interactively, as follows:
Use space bar or Tab key to display next event.
Use Backspace key to display previous event.
Use Enter key to select event.
Type letters to skip to events starting with the same letters
Note that Ctrl - c, and so on, are treated as letters.
Use the Esc key to finish.
-h This message (command not run)
-k Counts at privilege level 0 as well (default: off)
-l Lists names of all events (other arguments are ignored).
-o path Send output to path.cmd. pid instead of standard output.
-p Produces easier to parse output.
When using the lipfpm command, you can specify up to four events at a time. For MPI codes, the -f option is required. Event names are specified slightly differently than in the pfmon command.The -c options shows the named collection of events, as follows:
| Event | Description | |
| mi | Retired M and I type instructions | |
| mi_nop | Retired M and I type NOP instructions | |
| fb | Retired F and B type instructions | |
| fb_nop | Retired F and B type NOP instructions | |
| dlatNNN | Times L1D miss latency exceeded NNN | |
| dtlb | DTLB misses | |
| ilatNNN | Times L1I miss latency exceeded NNN | |
| itlb | ITLB misses | |
| bw | Counters associated with (read) bandwidth |
% lipfpm -c bw stream.1 Function Rate (MB/s) Avg time Min time Max time Copy: 3188.8937 0.0216 0.0216 0.0217 Scale: 3154.0994 0.0218 0.0218 0.0219 Add: 3784.2948 0.0273 0.0273 0.0274 Triad: 3822.2504 0.0270 0.0270 0.0272 lipfpm summary ====== ======= L1 Data Cache Read Misses -- all L1D read misses will be counted.................................................... 10791782 L2 Misses.................................................. 55595108 L3 Reads -- L3 Load Misses (excludes reads for ownership used to satisfy stores).................................... 55252613 CPU Cycles................................................. 3022194261 Average read MB/s requested by L1D......................... 342.801 Average MB/s requested by L2............................... 3531.96 Average data read MB/s requested by L3..................... 3510.2 |
The following list describes the event sources and types of sampling for the histx program.
| Event Sources | Description | |
| timer@N | Profiling timer events. A sample is recorded every N ticks. | |
| pm:event@N | Performance monitor events. A sample is recorded whenever the number of occurrences of event is N larger than the number of occurrences at the time of the previous sample. | |
| dlatM@N | A sample is recorded whenever the number of loads whose latency exceeded M cycles is N larger than the number at the time of the previous sample. M must be a power of 2 between 4 and 4096. |
Types of sample are, as follows:
| Types of Sampling | Description | |
| ip | Sample instruction pointer | |
| callstack[N] | Sample callstack. N, if given, specifies the maximum callstack depth (default: 8) |
The Intel VTune performance analyzer does remote sampling experiments. The VTune data collector runs on the Linux system and an accompanying GUI runs on an IA-32 Windows machine, which is used for analyzing the results. The version of VTune that runs on Linux does not have the full set of options of the Windows GUI.
For details about using VTune, see the following URL:
http://developer.intel.com/software/products/vtune/vpa/
| Note: VTune may not be available for this release. Consult your release notes for details about its availability. |
GuideView is a graphical tool that presents a window into the performance details of a program's parallel execution. GuideView is part of the KAP/Pro Toolset, which also includes the Guide OpenMP compiler and the Assure Thread Analyzer. GuideView is not a part of the default software installation with your system. GuideView is part ot Intel compilers.
GuideView uses an intuitive, color-coded display of parallel performance bottlenecks which helps pinpoint performance anomalies. It graphically illustrates each processor's activity at various levels of detail by using a hierarchical summary.
Statistical data is collapsed into relevant summaries that indicate where attention should be focused (for example, regions of the code where improvements in local performance will have the greatest impact on overall performance).
To gather programming statistics, use the -O3, -openmp, and -openmp_profile compiler options. This causes the linker to use libguide_stats.a instead of the default libguide.a. The following example demonstrates the compiler command line to produce a file named swim:
% efc -O3 -openmp -openmp_profile -o swim swim.f |
To obtain profiling data, run the program, as in this example:
% export OMP_NUM_THREADS=8 % ./swim < swim.in |
When the program finishes, the swim.gvs file is produced and it can be used with GuideView. To invoke GuideView with that file, use the following command:
% guideview -jpath=your_path_to_Java -mhz=998 ./swim.gvs. |
The graphical portions of GuideView require the use of Java. Java 1.1.6-8 and Java 1.2.2 are supported and later versions appear to work correctly. Without Java, the functionality is severely limited but text output is still available and is useful, as the following portion of the text file that is produced demonstrates:
Program execution time (in seconds): cpu : 0.07 sec elapsed : 69.48 sec serial : 0.96 sec parallel : 68.52 sec cpu percent : 0.10 % end Summary over all regions (has 4 threads): # Thread #0 #1 #2 #3 Sum Parallel : 68.304 68.230 68.240 68.185 Sum Imbalance : 1.020 0.592 0.892 0.838 Sum Critical Section: 0.011 0.022 0.021 0.024 Sum Sequential : 0.011 4.4e-03 4.6e-03 1.6e-03 Min Parallel : -5.1e-04 -5.1e-04 4.2e-04 -5.2e-04 Max Parallel : 0.090 0.090 0.090 0.090 Max Imbalance : 0.036 0.087 0.087 0.087 Max Critical Section: 4.6e-05 9.8e-04 6.0e-05 9.8e-04 Max Sequential : 9.8e-04 9.8e-04 9.8e-04 9.8e-04 end |
The following performance tools also can be of benefit when you are trying to optimize your code:
For details about these products, see the following website:
http://developer.intel.com/software/products/threading
| Note: These products have not been thoroughly tested on SGI systems. SGI takes no responsibility for the correct operation of third party products described or their suitability for any particular purpose. |
Three debuggers are available to help you analyze your code:
gdb: the GNU project debugger. This is useful for debugging programs written in C, C++, and Fortran 95. When compiling with C and C++, include the -g option on the compiler command line to produce the dwarf2 symbols database used by gdb.
When using gdb for Fortran debugging, include the -g and -O0 options. Do not use gdb for Fortran debugging when compiling with -O1 or higher.
The debugger to be used for Fortran 95 codes can be downloaded from http://sourceforge.net/project/showfiles.php?group_id=56720 . (Note that the standard gdb compiler does not support Fortran 95 codes.) To verify that you have the correct version of gdb installed, use the gdb -v command. The output should appear similar to the following:
GNU gdb 5.1.1 FORTRAN95-20020628 (RC1)
Copyright 2002 Free Software Foundation, Inc.
For a complete list of gdb commands, see the gdb user guide online at http://sources.redhat.com/gdb/onlinedocs/gdb_toc.html or use the help option. Note that current instances of gdb do not report ar.ec registers correctly. If you are debugging rotating, register-based, software-pipelined loops at the assembly code level, try using idb instead.
idb: the Intel debugger. This is a fully symbolic debugger for the Linux platform. The debugger provides extensive support for debugging programs written in C, C++, FORTRAN 77, and Fortran 90.
Running idb with the -gdb option on the shell command line provides gdb-like user commands and debugger output.
ddd: a GUI to a command line debugger. It supports gdb and idb. For details about usage, see the following subsection.
TotalView: a licensed graphical debugger useful in an MPI environment (see http://www.totalviewtech.com/ )
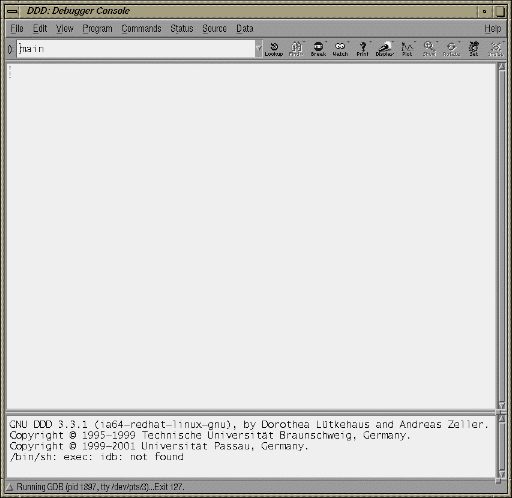
The DataDisplayDebugger ddd(1) tool is a GUI to an arbitrary command line debugger as shown in Figure 3-1. When starting ddd, use the --debugger option to specify the debugger used (for example, --debugger "idb"). The default debugger used is gdb.
When the debugger is loaded the DataDisplayDebugger screen appears divided into panes that show the following information:
Array inspection
Source code
Disassembled code
A command line window to the debugger engine
These panes can be switched on and off from the View menu.
Some commonly used commands can be found on the menus. In addition, the following actions can be useful:
Select an address in the assembly view, click the right mouse button, and select lookup. The gdb command is executed in the command pane and it shows the corresponding source line.
Select a variable in the source pane and click the right mouse button. The current value is displayed. Arrays are displayed in the array inspection window. You can print these arrays to PostScript by using the Menu>Print Graph option.
You can view the contents of the register file, including general, floating-point, NaT, predicate, and application registers by selecting Registers from the Status menu. The Status menu also allows you to view stack traces or to switch OpenMP threads.